带你十天轻松搞定 Go 微服务系列(八、服务监控)
序言
我们通过一个系列文章跟大家详细展示一个 go-zero 微服务示例,整个系列分十篇文章,目录结构如下:
- 环境搭建
- 服务拆分
- 用户服务
- 产品服务
- 订单服务
- 支付服务
- RPC 服务 Auth 验证
- 服务监控(本文)
- 链路追踪
- 分布式事务
期望通过本系列带你在本机利用 Docker 环境利用 go-zero 快速开发一个商城系统,让你快速上手微服务。
完整示例代码:https://github.com/nivin-studio/go-zero-mall
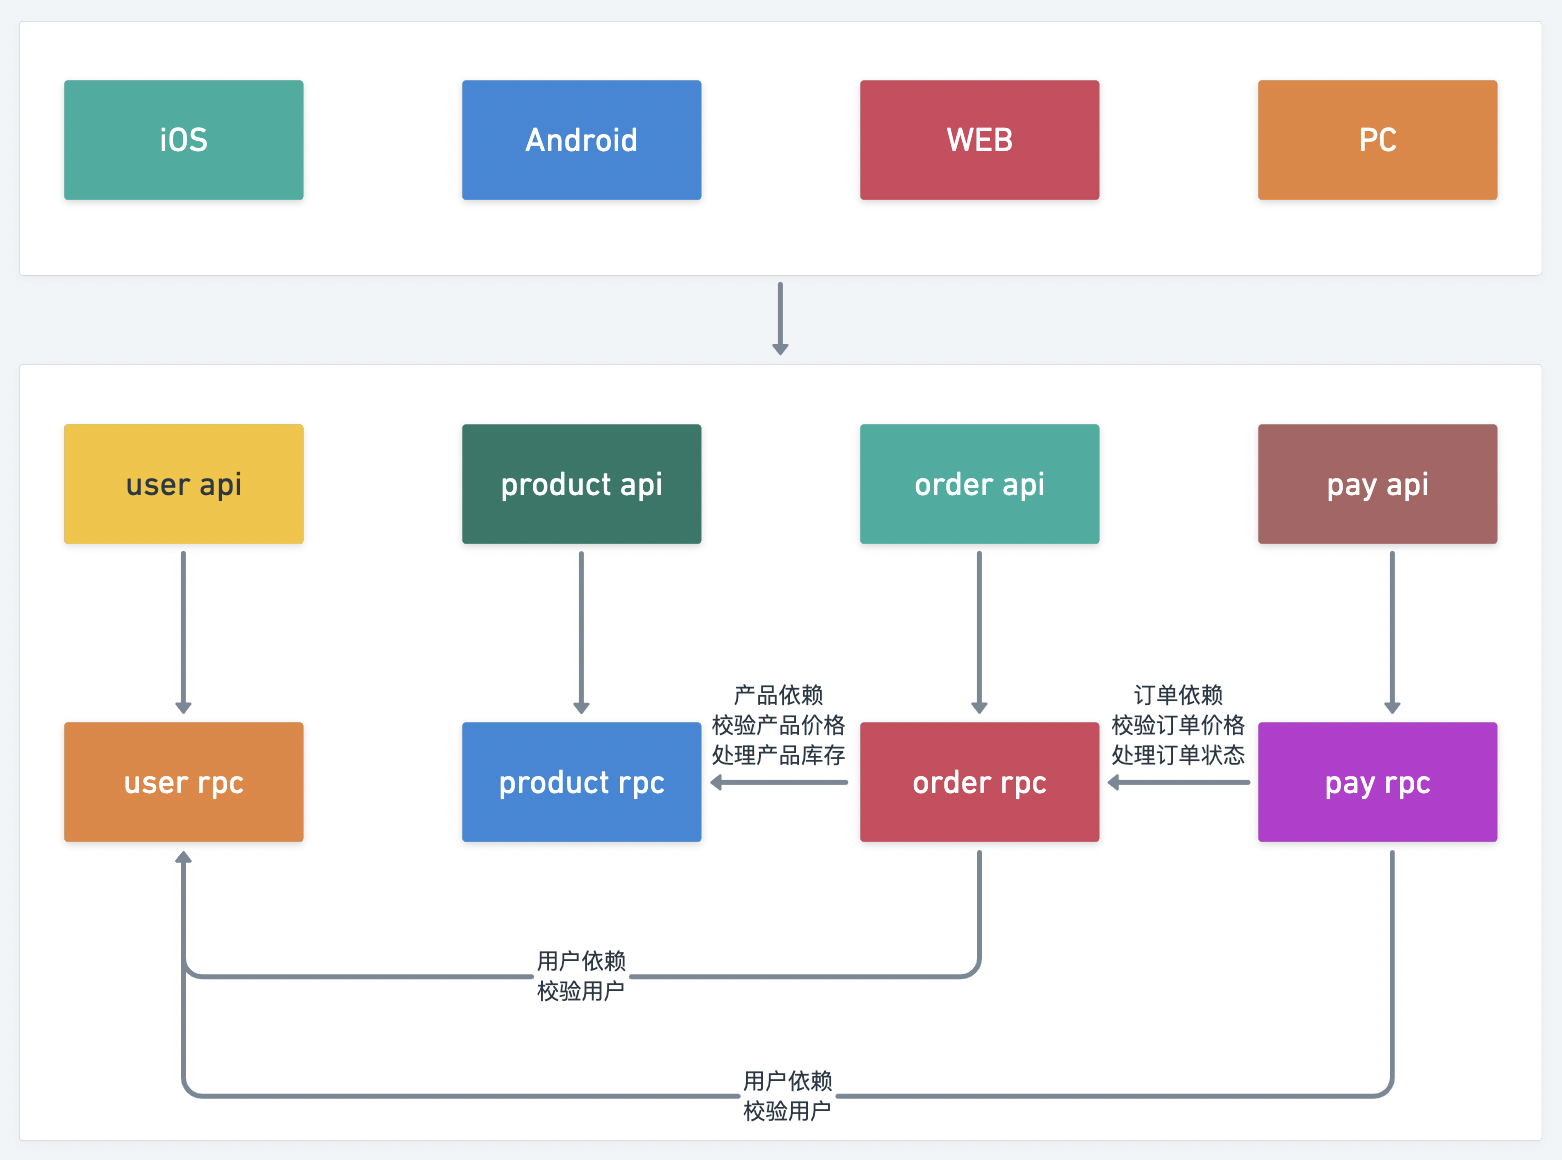
首先,我们来看一下整体的服务拆分图:
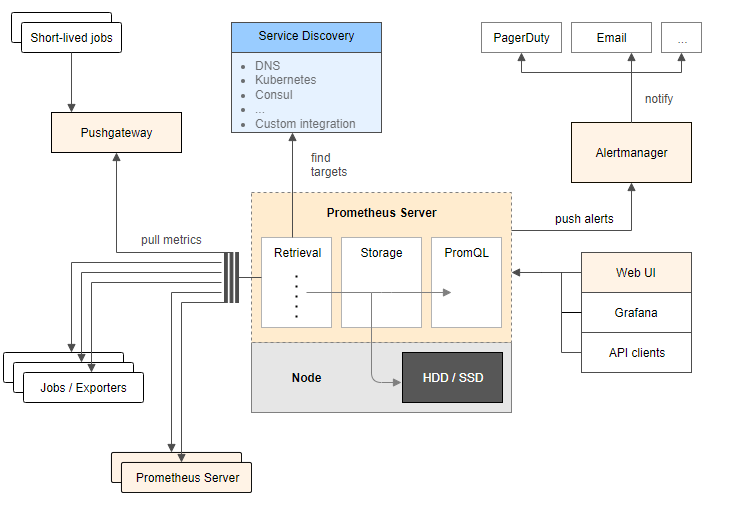
8.1 Prometheus 介绍
Prometheus 是一款基于时序数据库的开源监控告警系统,基本原理是通过 HTTP 协议周期性抓取被监控服务的状态,任意服务只要提供对应的 HTTP 接口就可以接入监控。不需要任何 SDK 或者其他的集成过程,输出被监控服务信息的 HTTP 接口被叫做 exporter 。目前互联网公司常用的服务大部分都有 exporter 可以直接使用,比如 Varnish、Haproxy、Nginx、MySQL、Linux 系统信息(包括磁盘、内存、CPU、网络等等)。Promethus 有以下特点:
- 支持多维数据模型(由度量名和键值对组成的时间序列数据)
- 支持
PromQL查询语言,可以完成非常复杂的查询和分析,对图表展示和告警非常有意义 - 不依赖分布式存储,单点服务器也可以使用
- 支持
HTTP协议主动拉取方式采集时间序列数据 - 支持
PushGateway推送时间序列数据 - 支持服务发现和静态配置两种方式获取监控目标
- 支持接入
Grafana
8.2 go-zero 使用 Prometheus 监控服务
go-zero 框架中集成了基于 Prometheus 的服务指标监控,go-zero 目前在 http 的中间件和 rpc 的拦截器中添加了对请求指标的监控。
主要从 请求耗时 和 请求错误 两个维度,请求耗时采用了 Histogram 指标类型定义了多个 Buckets 方便进行分位统计,请求错误采用了 Counter 类型,并在 http metric 中添加了 path 标签,rpc metric 中添加了 method 标签以便进行细分监控。
接下来我们分别为前面几章实现的服务添加 Prometheus 监控,首先我们先回顾下 第二章 服务拆分,为了模拟服务的分布式部署,我们是在一个容器里启动了所有的服务,并为其分配了不同的端口号。下面我们再为这些服务分配一个 Prometheus 采集指标数据的端口号。
| 服务 | api 服务端口号 | rpc 服务端口号 | api 指标采集端口号 | rpc 指标采集端口号 |
|---|---|---|---|---|
user | 8000 | 9000 | 9080 | 9090 |
product | 8001 | 9001 | 9081 | 9091 |
order | 8002 | 9002 | 9082 | 9092 |
pay | 8003 | 9003 | 9083 | 9093 |
8.2.1 添加 user api 服务 Prometheus 配置
$ vim mall/service/user/api/etc/user.yaml
Name: User
Host: 0.0.0.0
Port: 8000

...

Prometheus:
  Host: 0.0.0.0
  Port: 9080
  Path: /metrics
8.2.2 添加 user rpc 服务 Prometheus 配置
$ vim mall/service/user/rpc/etc/user.yaml
Name: user.rpc
ListenOn: 0.0.0.0:9000

...

Prometheus:
  Host: 0.0.0.0
  Port: 9090
  Path: /metrics
8.2.3 添加 product api 服务 Prometheus 配置
$ vim mall/service/product/api/etc/product.yaml
Name: Product
Host: 0.0.0.0
Port: 8001

...

Prometheus:
  Host: 0.0.0.0
  Port: 9081
  Path: /metrics
8.2.4 添加 product rpc 服务 Prometheus 配置
$ vim mall/service/product/rpc/etc/product.yaml
Name: product.rpc
ListenOn: 0.0.0.0:9001

...

Prometheus:
  Host: 0.0.0.0
  Port: 9091
  Path: /metrics
8.2.5 添加 order api 服务 Prometheus 配置
$ vim mall/service/order/api/etc/order.yaml
Name: Order
Host: 0.0.0.0
Port: 8002

...

Prometheus:
  Host: 0.0.0.0
  Port: 9082
  Path: /metrics
8.2.6 添加 order rpc 服务 Prometheus 配置
$ vim mall/service/order/rpc/etc/order.yaml
Name: order.rpc
ListenOn: 0.0.0.0:9002

...

Prometheus:
  Host: 0.0.0.0
  Port: 9092
  Path: /metrics
8.2.7 添加 pay api 服务 Prometheus 配置
$ vim mall/service/pay/api/etc/pay.yaml
Name: Pay
Host: 0.0.0.0
Port: 8003

...

Prometheus:
  Host: 0.0.0.0
  Port: 9083
  Path: /metrics
8.2.8 添加 pay rpc 服务 Prometheus 配置
$ vim mall/service/pay/rpc/etc/pay.yaml
Name: pay.rpc
ListenOn: 0.0.0.0:9003

...

Prometheus:
  Host: 0.0.0.0
  Port: 9093
  Path: /metrics
提示:配置修改后,需要重启服务才会生效。
8.2.9 修改 Prometheus 配置
在 第一章 环境搭建 中我们集成了 Prometheus 服务,在prometheus 目录下有个 prometheus.yml 的配置文件,我们现在需要修改这个配置文件。
# my global config
global:
  scrape_interval: 15s # Set the scrape interval to every 15 seconds. Default is every 1 minute.
  evaluation_interval: 15s # Evaluate rules every 15 seconds. The default is every 1 minute.
  # scrape_timeout is set to the global default (10s).

# Alertmanager configuration
alerting:
  alertmanagers:
    - static_configs:
        - targets:
          # - alertmanager:9093

# Load rules once and periodically evaluate them according to the global 'evaluation_interval'.
rule_files:
  # - "first_rules.yml"
  # - "second_rules.yml"

# A scrape configuration containing exactly one endpoint to scrape:
# Here it's Prometheus itself.
scrape_configs:
  # The job name is added as a label `job=<job_name>` to any timeseries scraped from this config.
  - job_name: "prometheus"

    # metrics_path defaults to '/metrics'
    # scheme defaults to 'http'.

    static_configs:
      - targets: ["localhost:9090"]

  # 我们自己的商城项目配置
  - job_name: 'mall'
    static_configs:
      # 目标的采集地址
      - targets: ['golang:9080']
        labels:
          # 自定义标签
          app: 'user-api'
          env: 'test'

      - targets: ['golang:9090']
        labels:
          app: 'user-rpc'
          env: 'test'

      - targets: ['golang:9081']
        labels:
          app: 'product-api'
          env: 'test'

      - targets: ['golang:9091']
        labels:
          app: 'product-rpc'
          env: 'test'

      - targets: ['golang:9082']
        labels:
          app: 'order-api'
          env: 'test'

      - targets: ['golang:9092']
        labels:
          app: 'order-rpc'
          env: 'test'

      - targets: ['golang:9083']
        labels:
          app: 'pay-api'
          env: 'test'

      - targets: ['golang:9093']
        labels:
          app: 'pay-rpc'
          env: 'test'
提示:配置文件修改好后,需要重启
Prometheus服务容器才能生效。
8.2.10 访问 Prometheus 可视化界面
- 在 第一章 环境搭建 中我们集成了
Prometheus服务,并为其端口号9090做了宿主机端口3000的映射关系,所以在浏览器中输入http://127.0.0.1:3000/访问Prometheus界面。
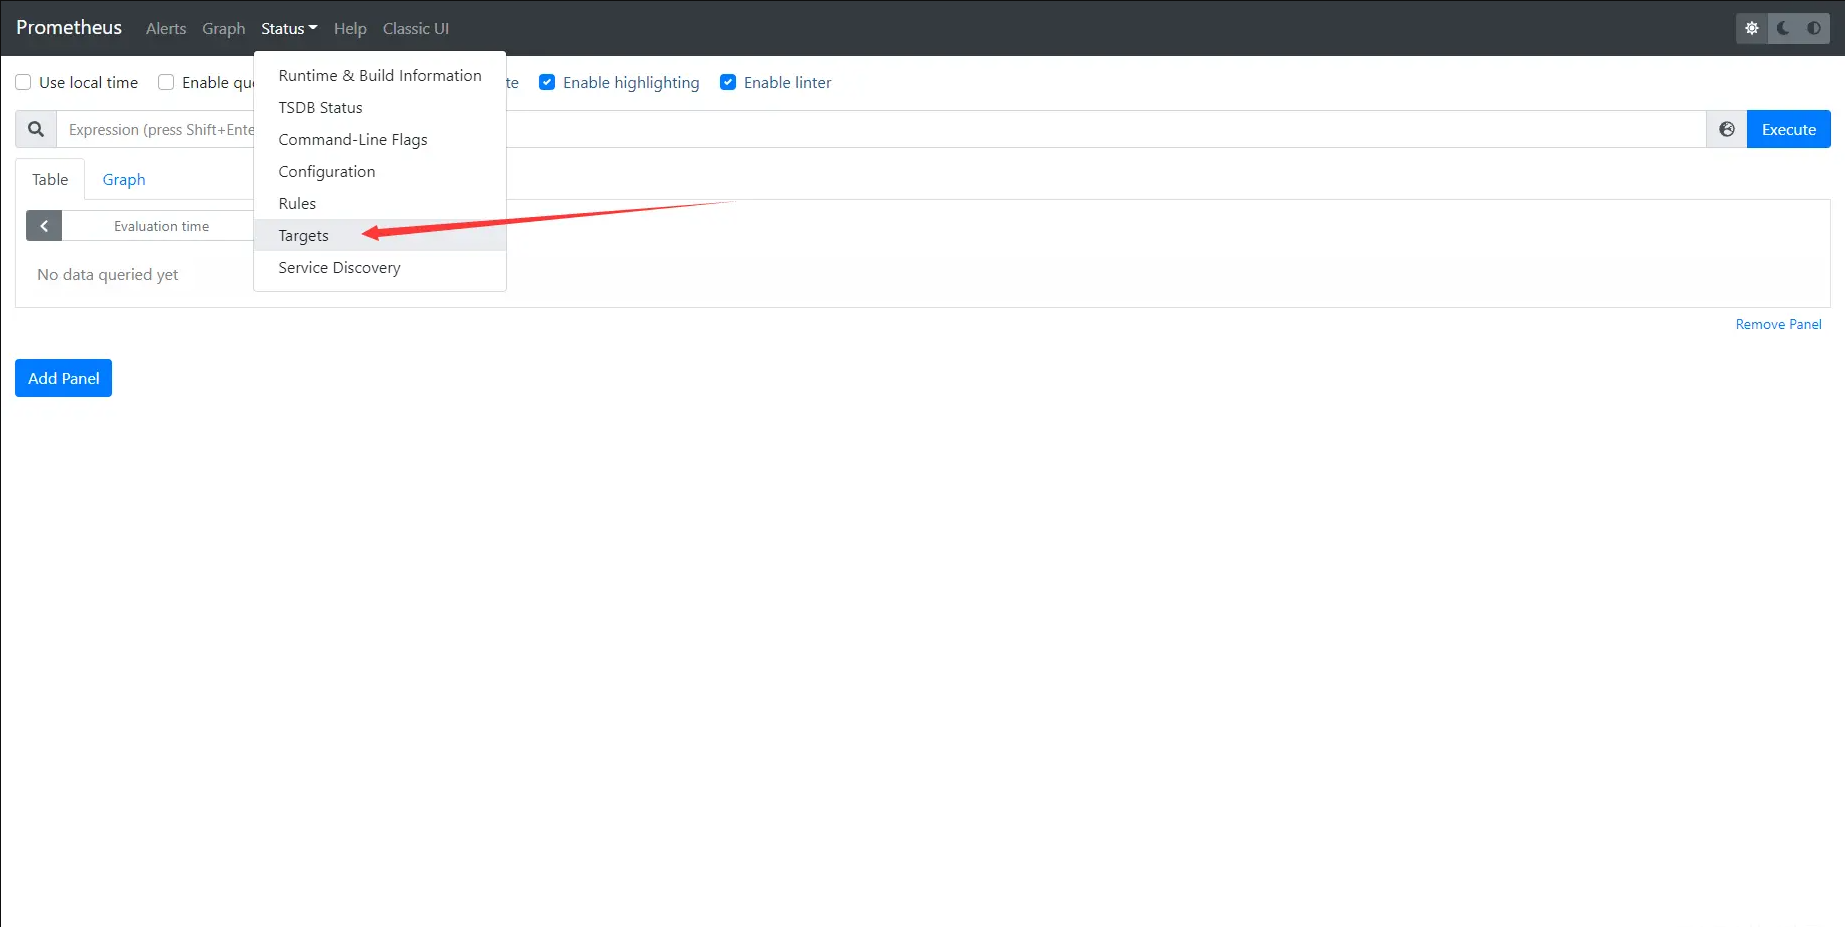
- 选择
Status->Targets菜单,即可看到我们配置的采集目标的状态和自定义的标签。

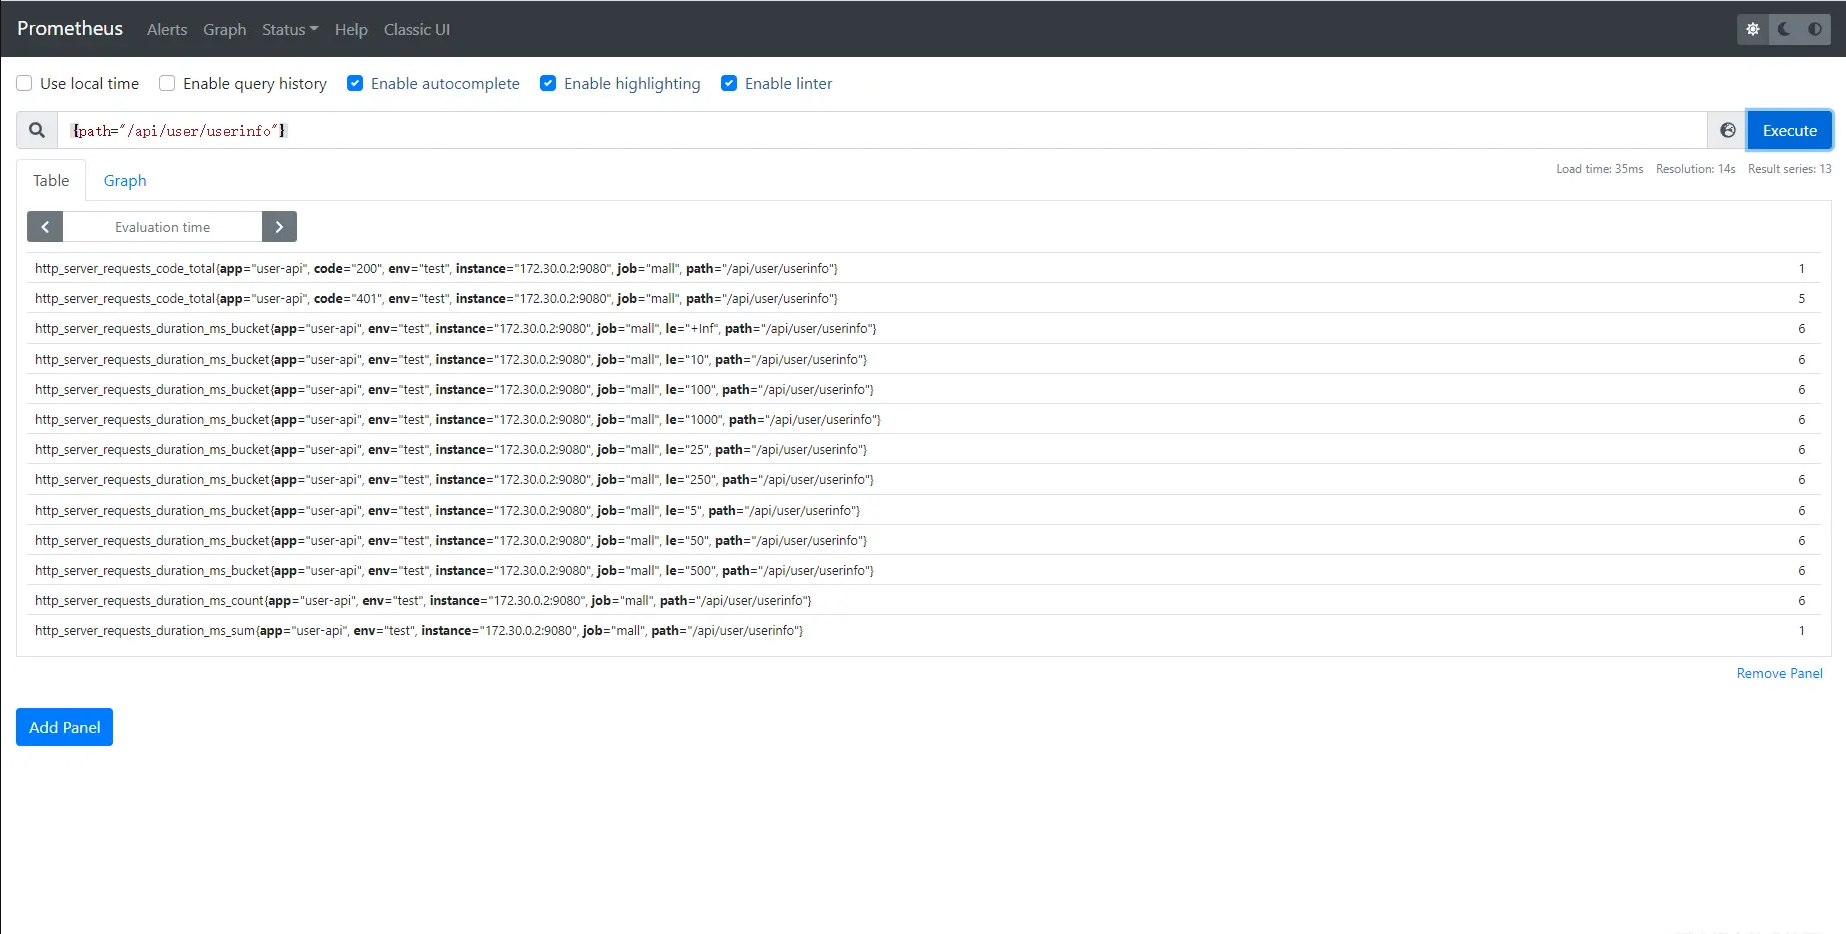
- 我们多次访问
api服务的接口后,选择Graph菜单,在查询输入框中输入{path="api接口地址"}或者{method="rpc接口方法"}指令,即可查看监控指标。

8.3 使用 Grafana 可视化 Prometheus 指标数据
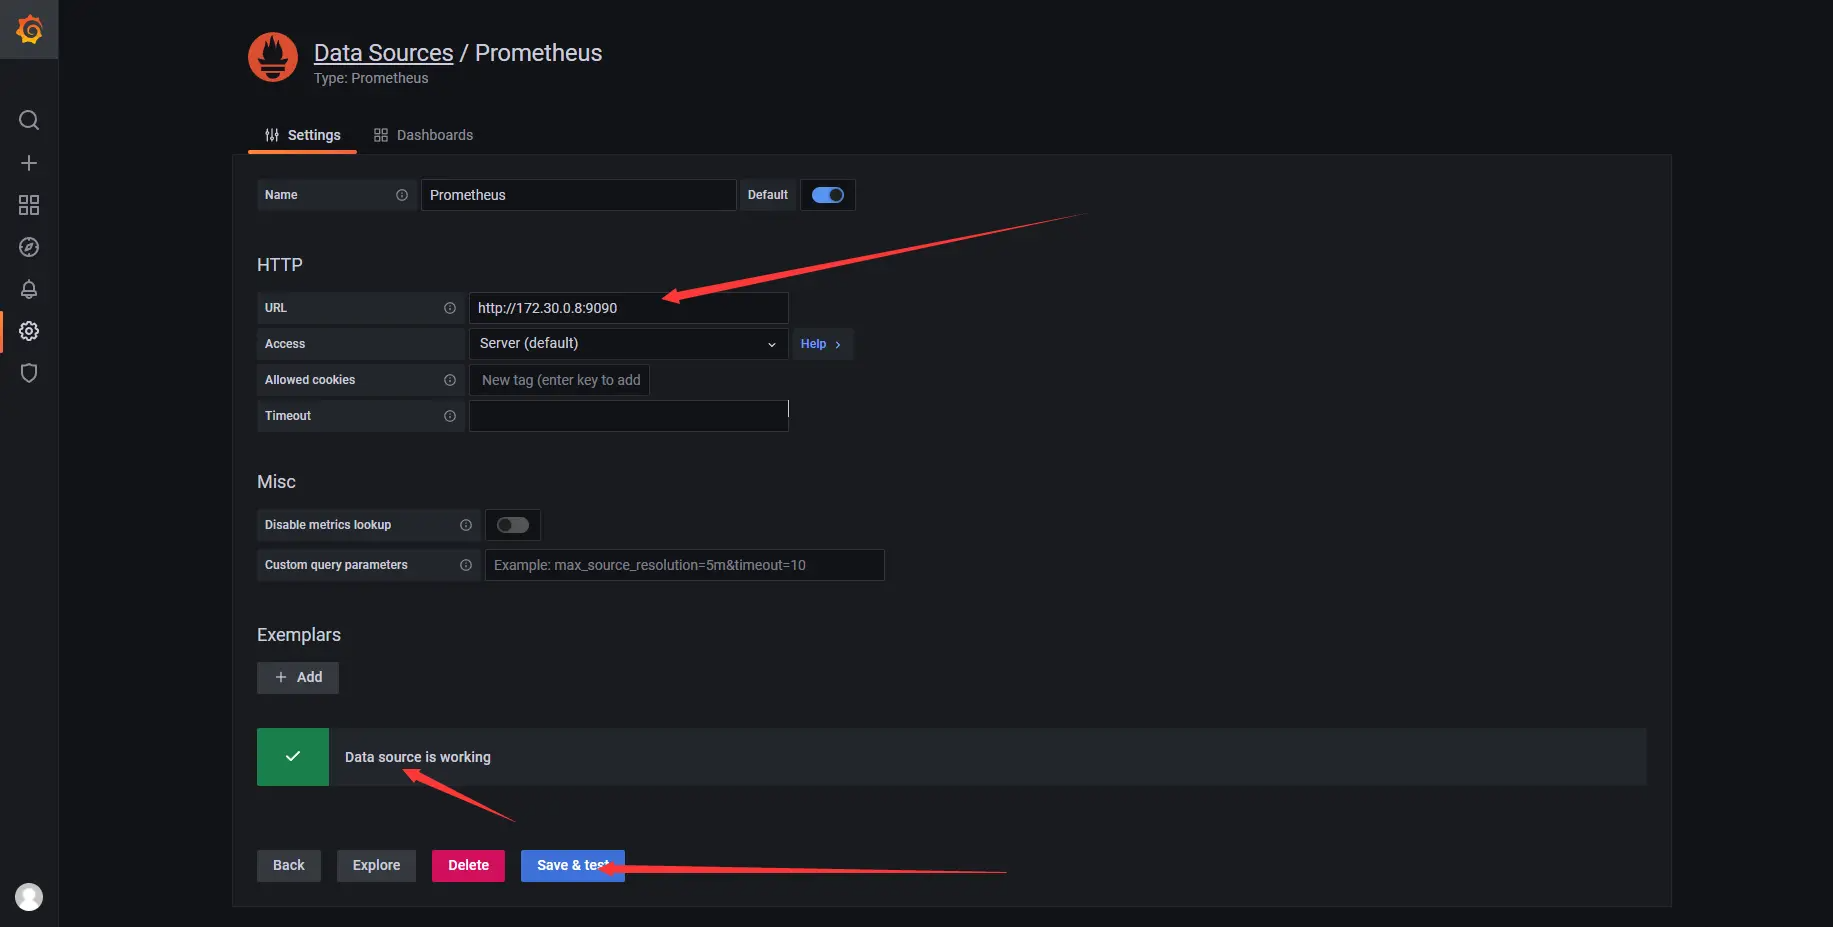
8.3.1 添加 Prometheus 数据源
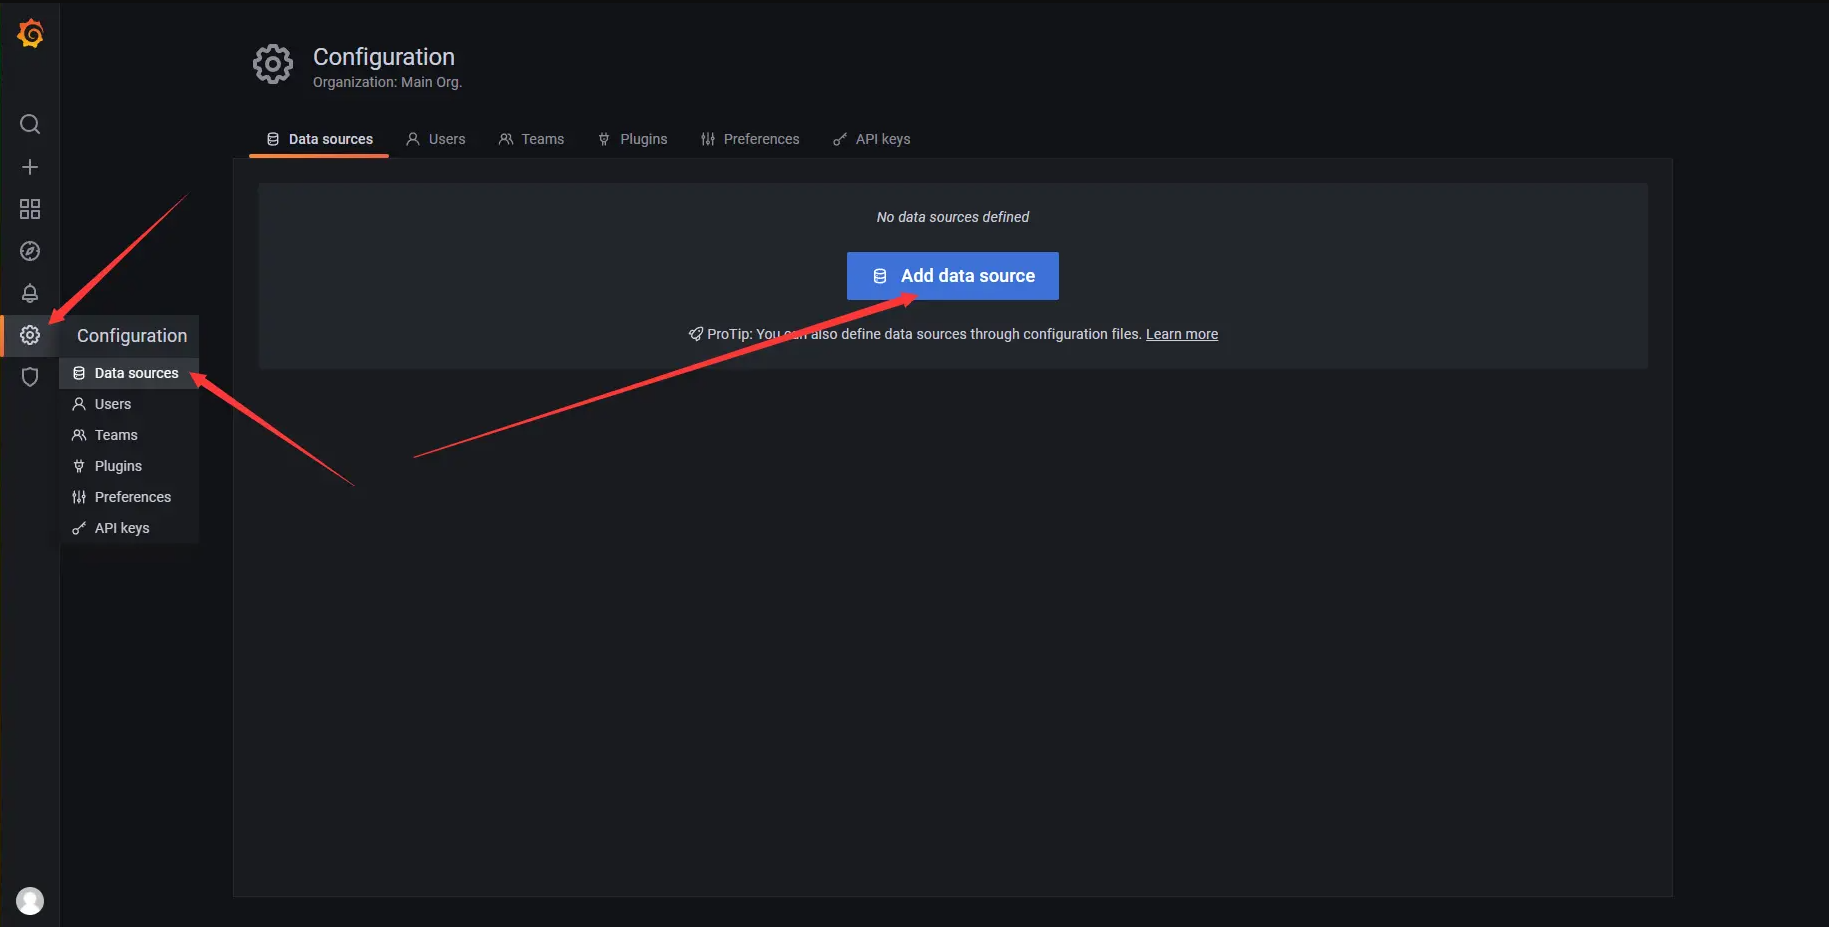
- 在 第一章 环境搭建 中我们集成了
Grafana服务,并为其端口号3000做了宿主机端口4000的映射关系,所以在浏览器中输入http://127.0.0.1:4000/访问Grafana界面。点击左侧边栏Configuration->Data Source->Add data source进行数据源添加。
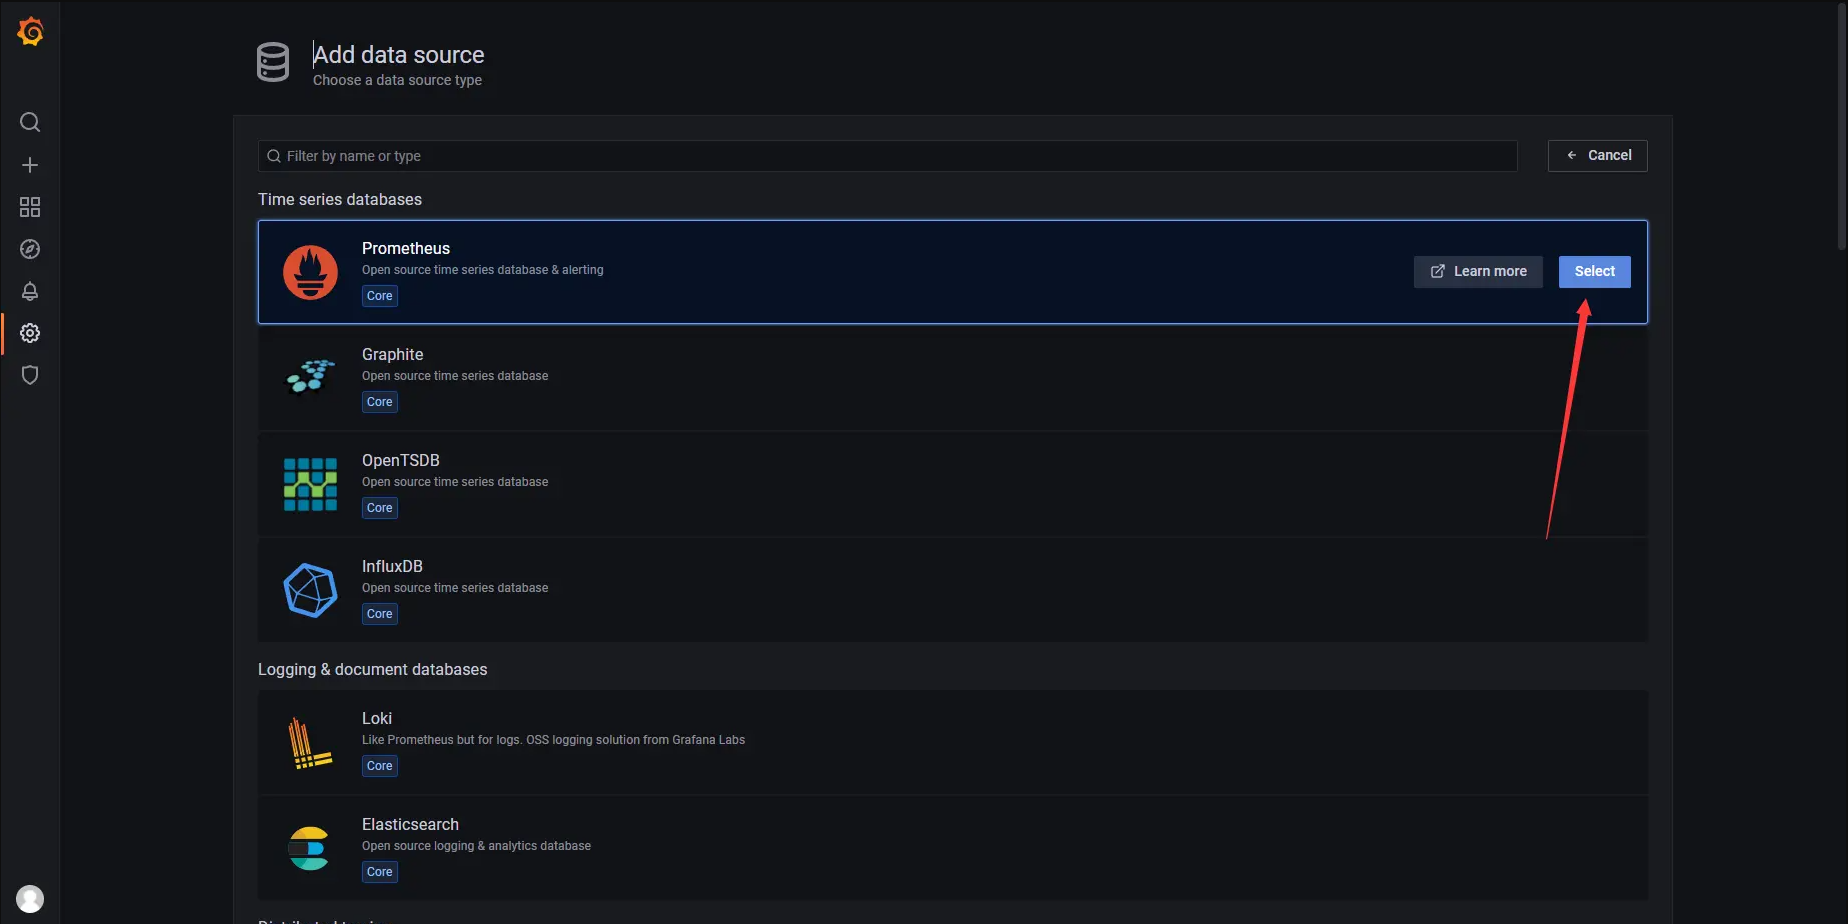
- 然后选择
Prometheus数据源
- 填写
HTTP配置中URL地址(我这里的IP地址是Prometheus所在容器的IP地址),然后点击Save & test按,上方会提示Data source is working,说明我们数据源添加成功且正常工作。
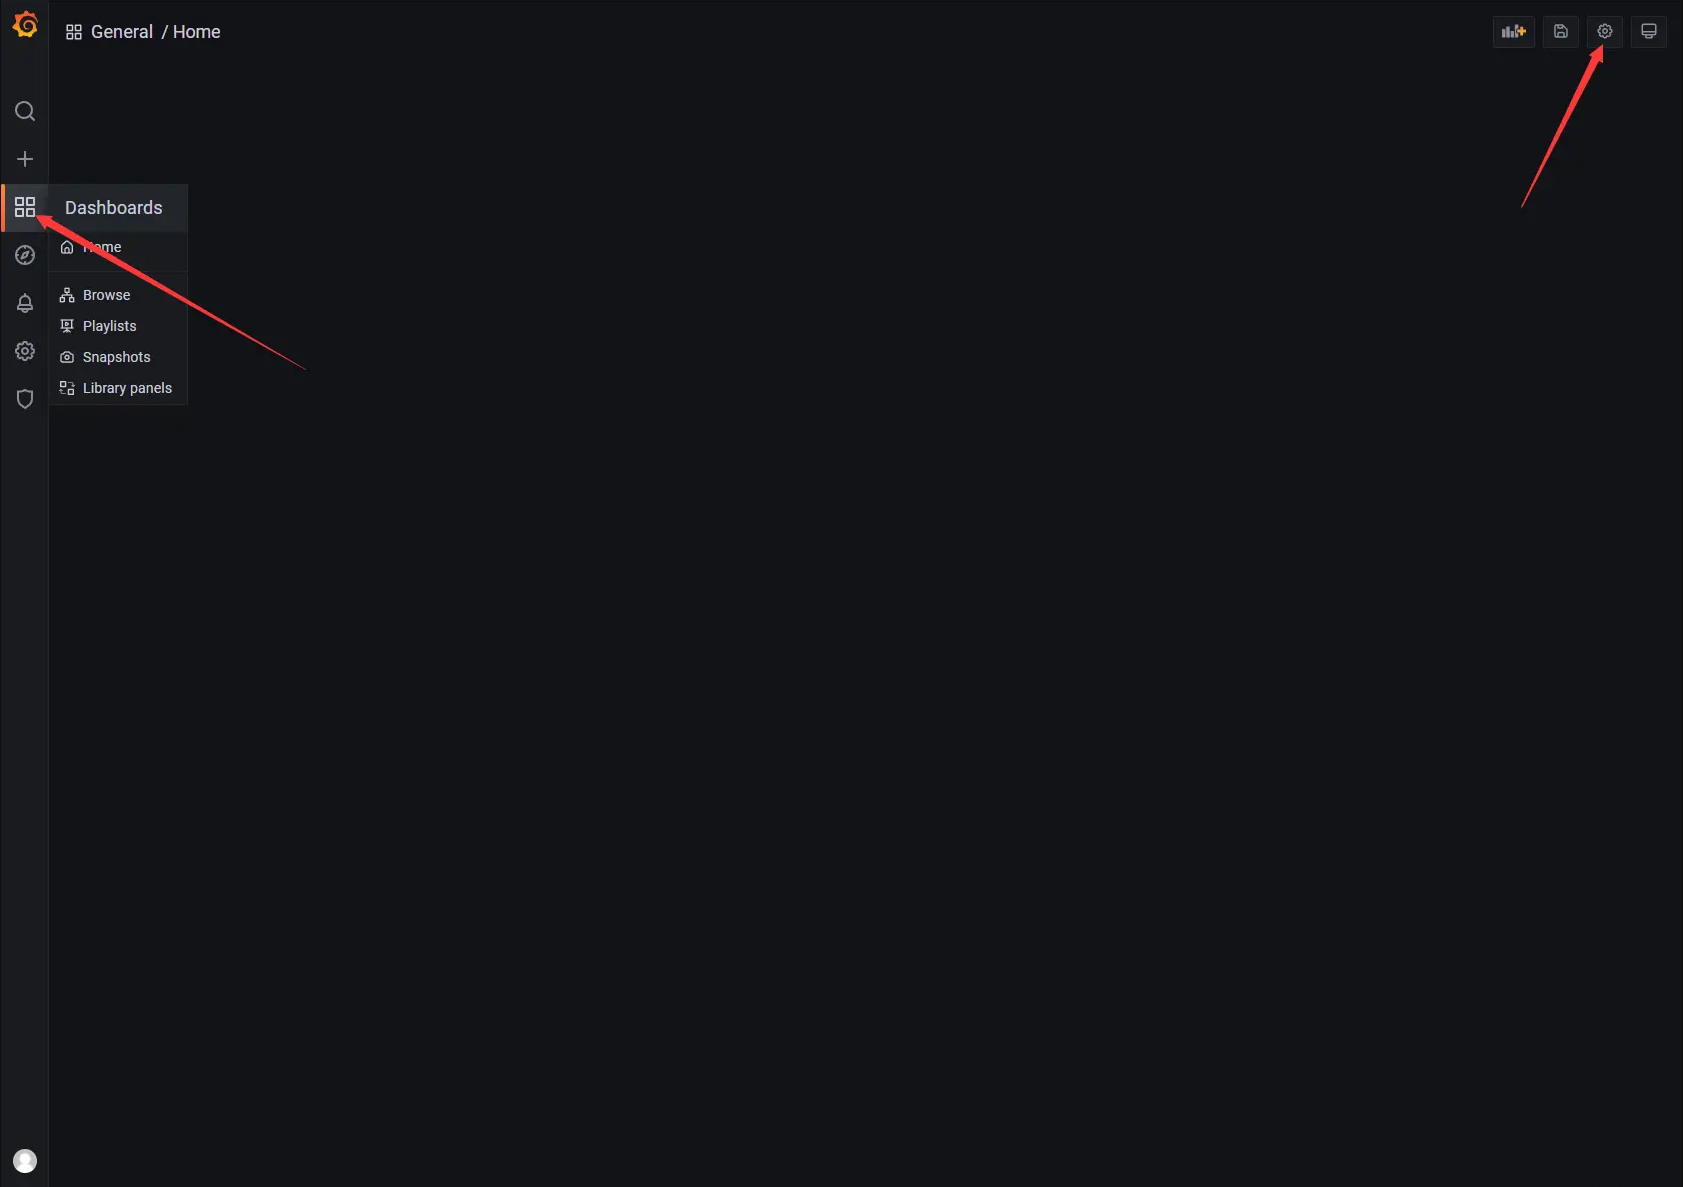
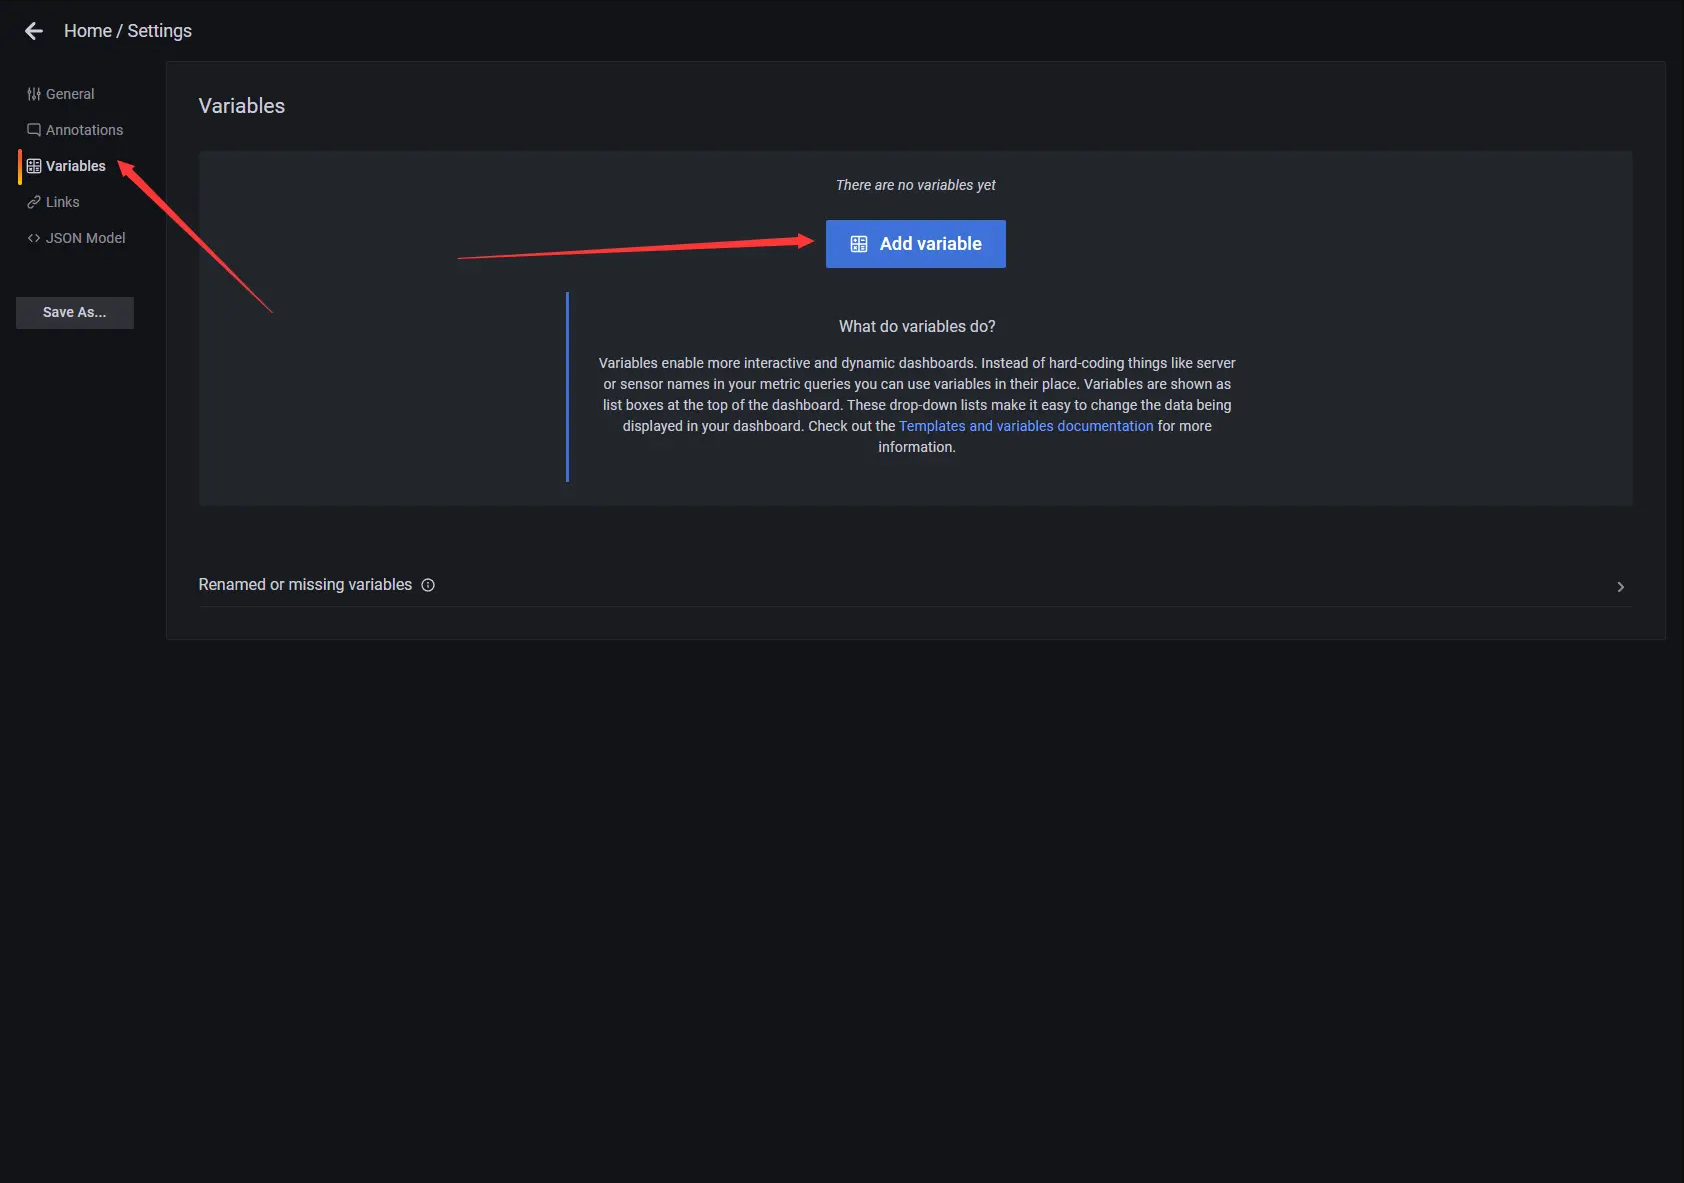
8.3.2 添加 Variables 用于服务筛选
- 点击左侧边栏
Dashboard选择右上角Dashboard settings按钮,在Settings页面选择Variables->Add variable添加变量,方便针对不同的标签进行过滤筛选。
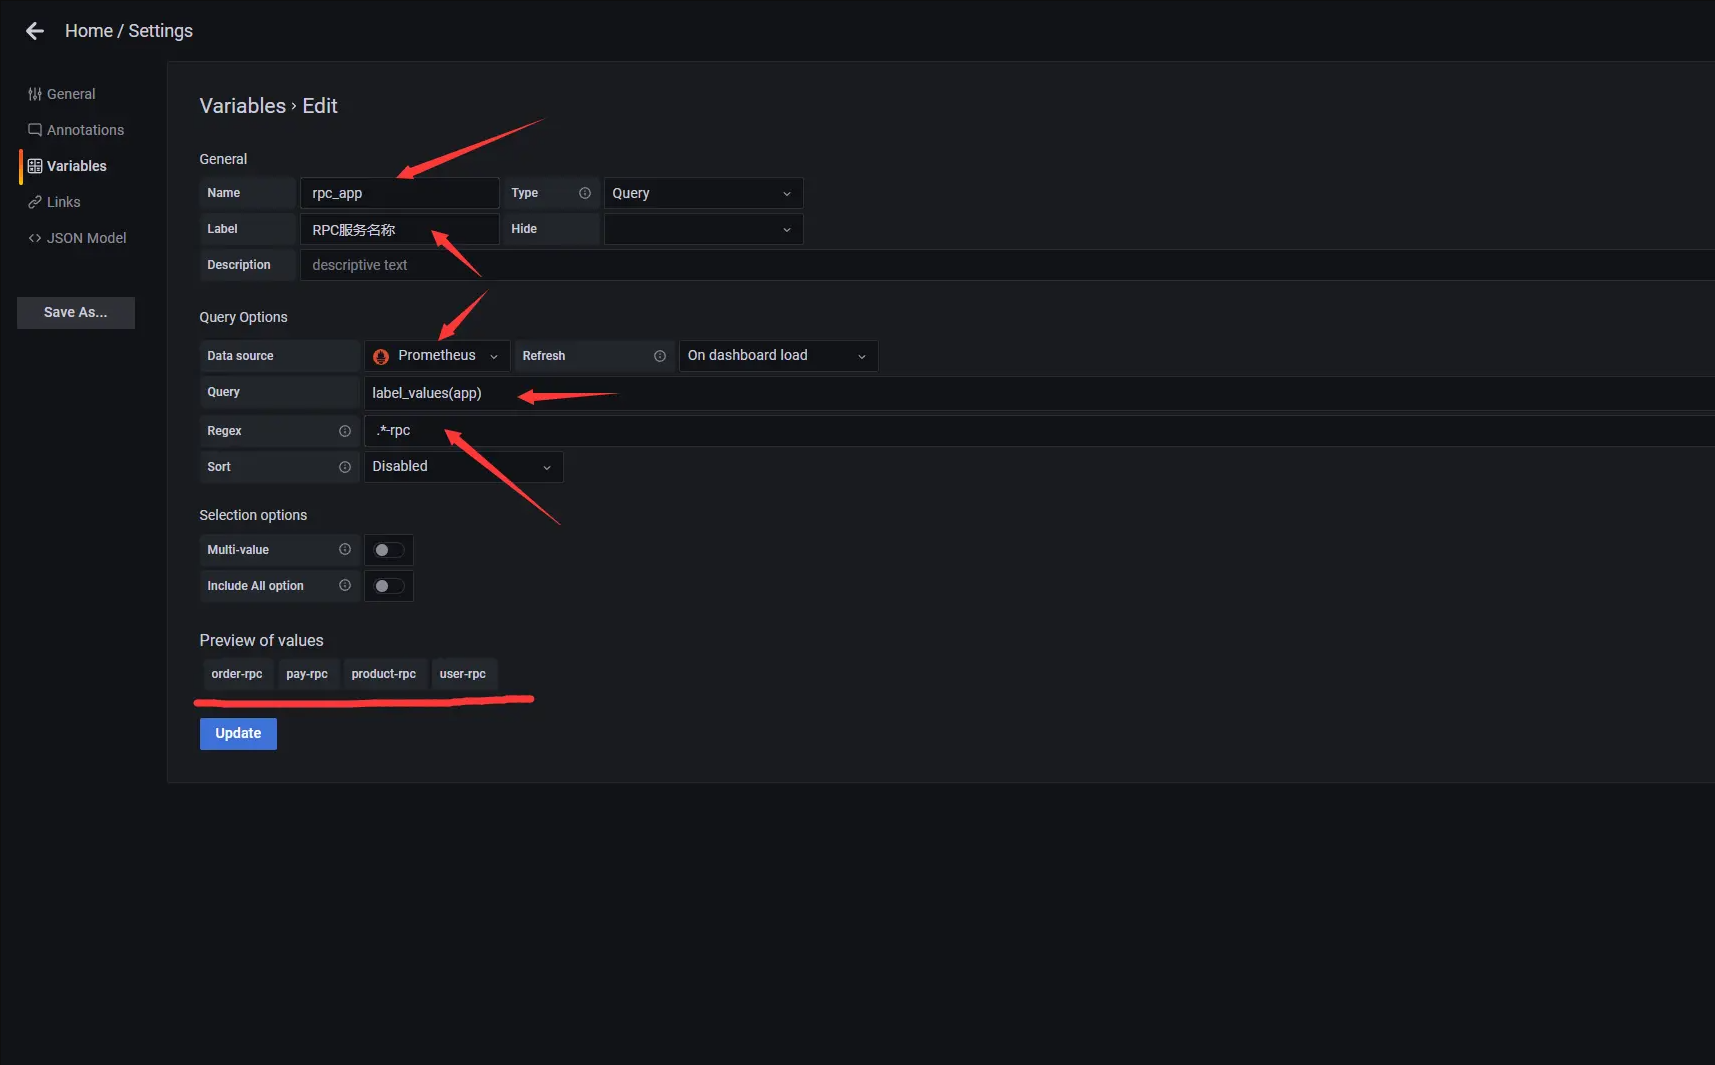
- 分别添加
api_appAPI服务名称,rpc_appRPC服务名称变量,用于不同服务的筛选。变量数据源选择Prometheus数据源,使用正则表达式提取出对应的app标签。

8.3.3 添加 api 接口 qps 仪表盘
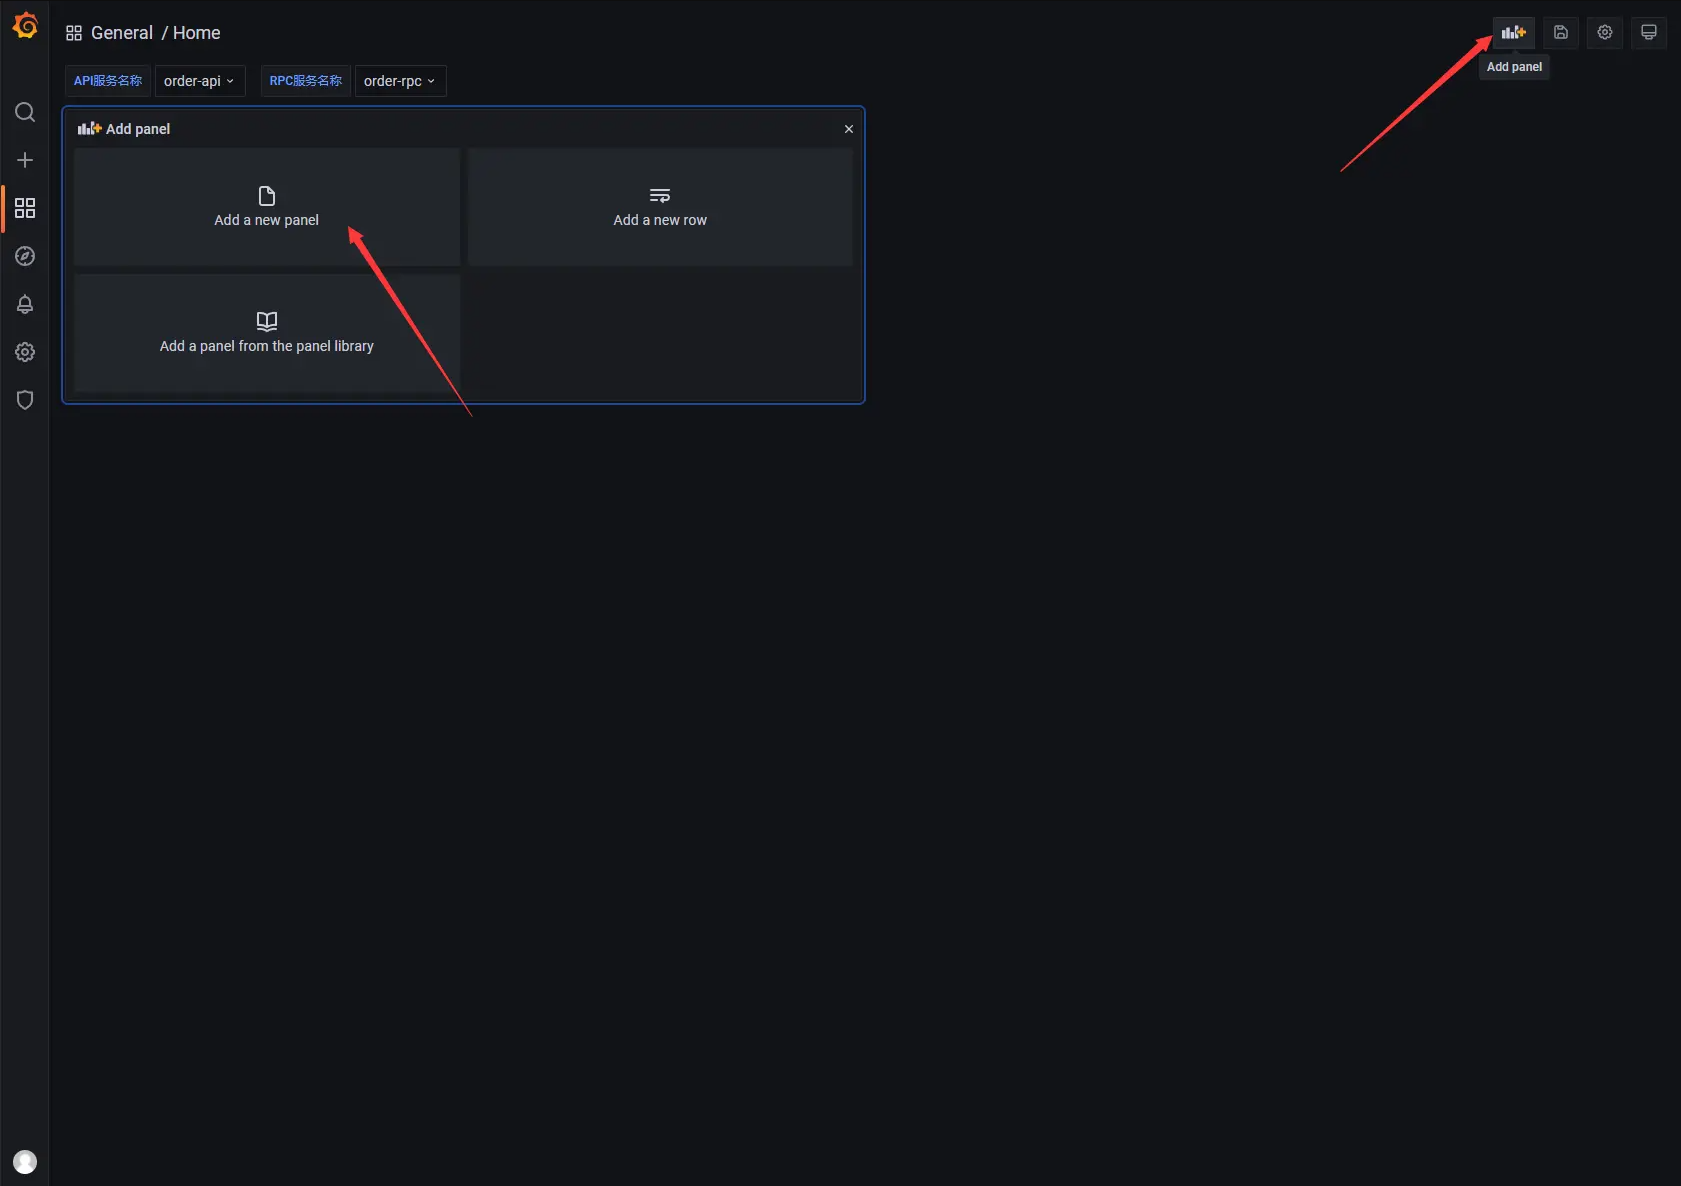
- 回到
Dashboard页面选择右上角Add panel按钮,然后再选择Add an empty panel添加一个空的面板。
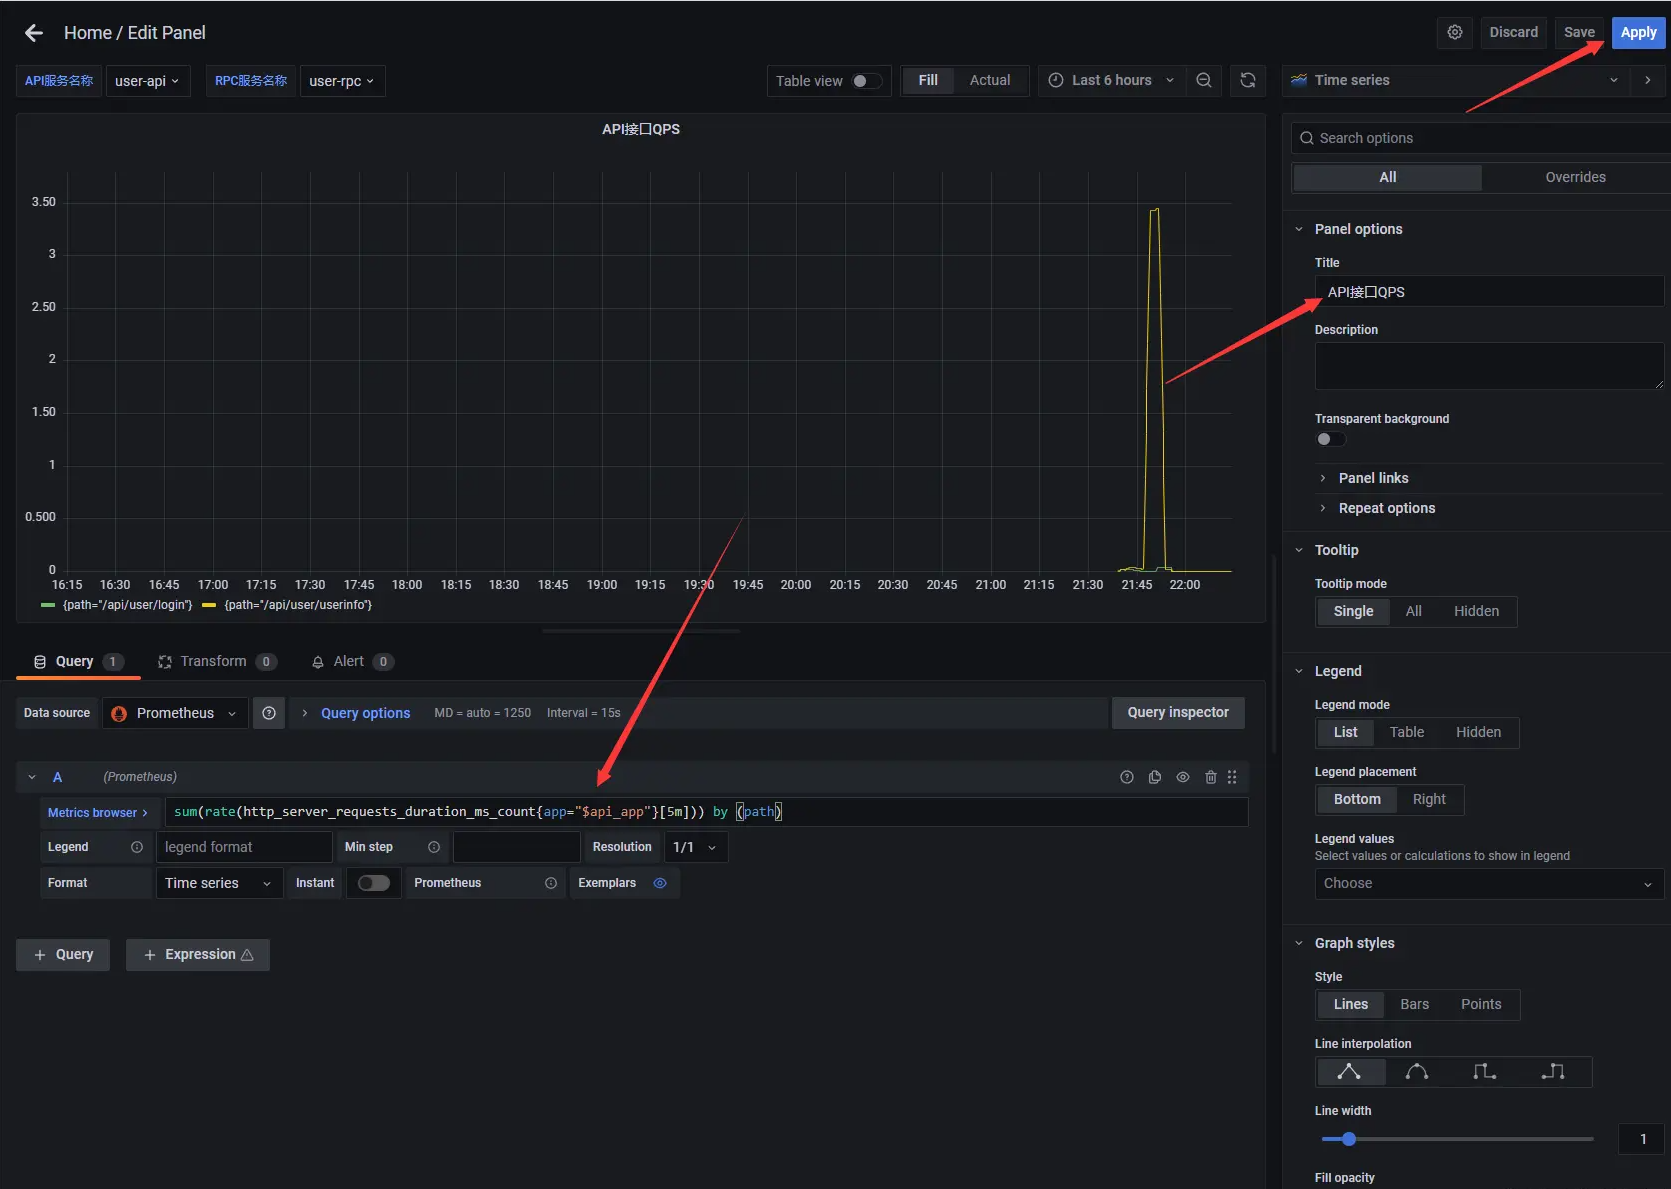
- 面板编辑页,修改面板标题为
API接口QPS,在Metrics中输入sum(rate(http_server_requests_duration_ms_count{app="$api_app"}[5m])) by (path)以path维度统计api接口的qps
8.3.4 添加 rpc 接口 qps 仪表盘
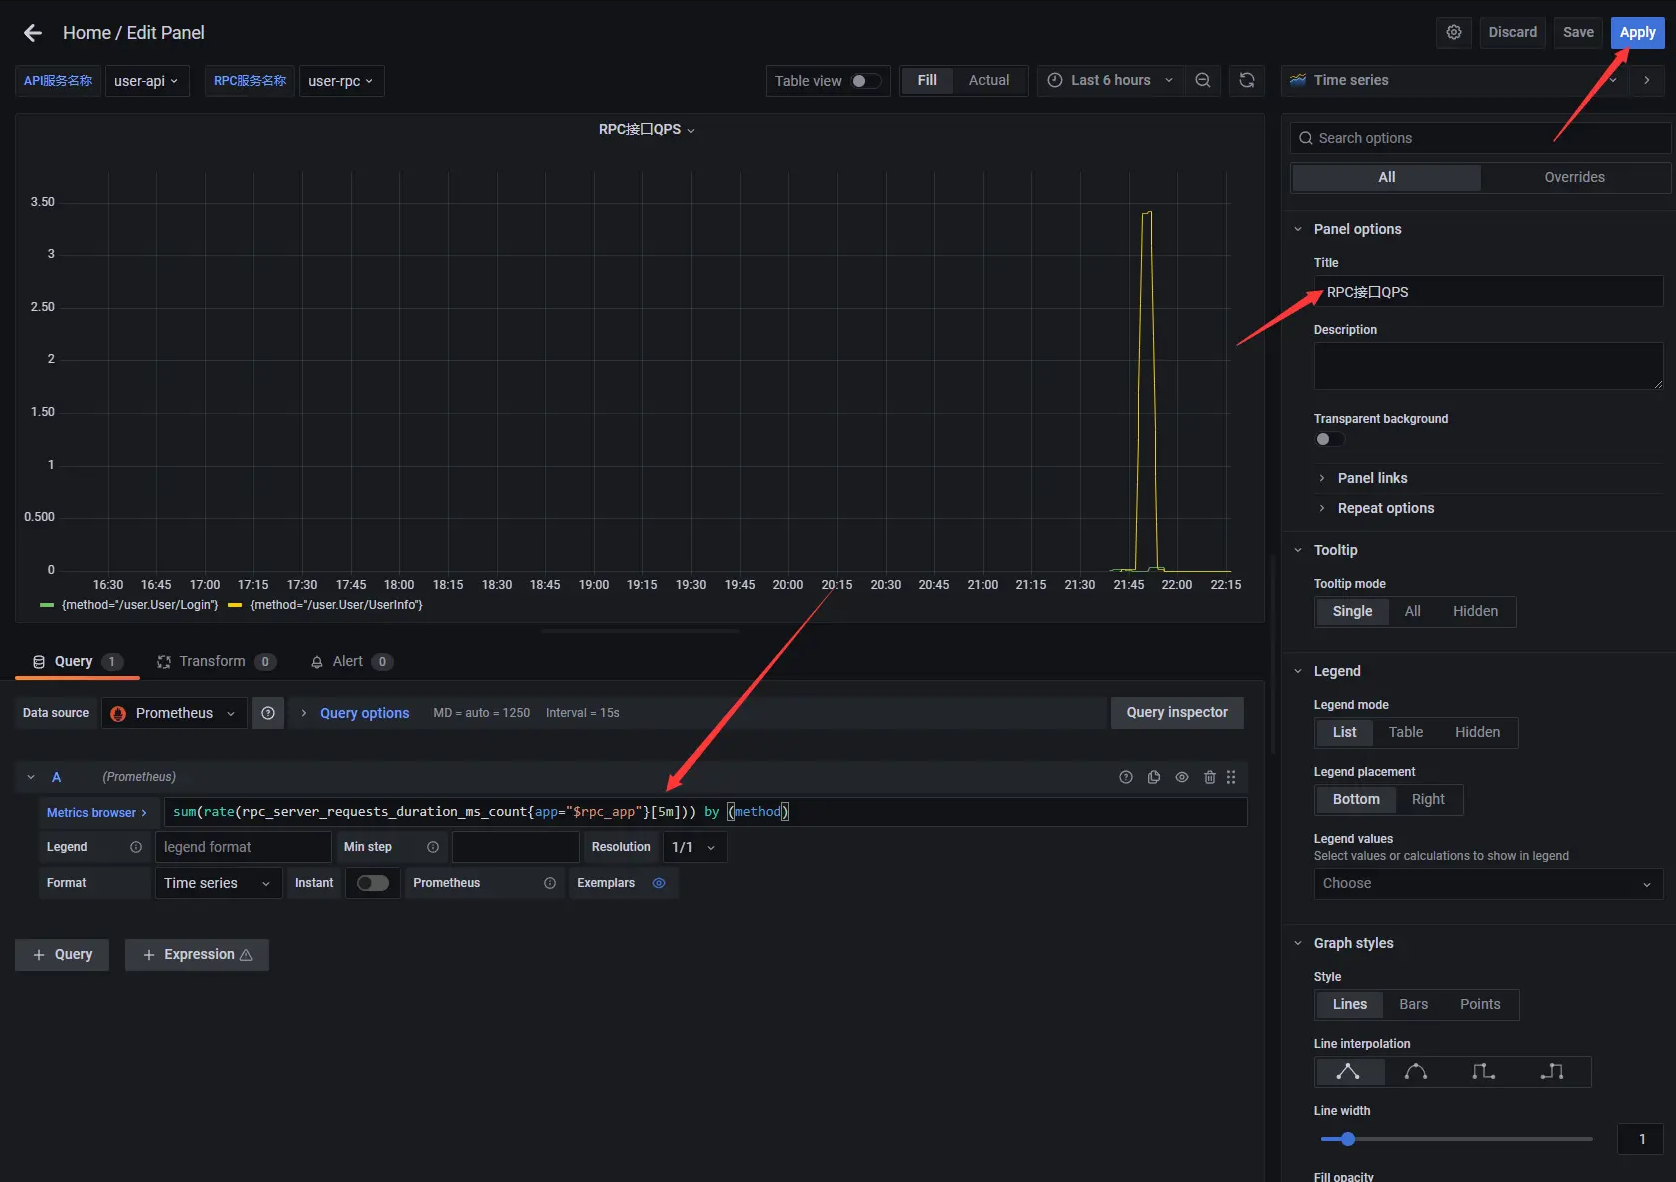
- 再新建一个面板,修改面板标题为
RPC接口QPS,在Metrics中输入sum(rate(rpc_server_requests_duration_ms_count{app="$rpc_app"}[5m])) by (method)以method维度统计rpc接口的qps
8.3.5 添加 api 接口状态码仪表盘
- 再新建一个面板,修改面板标题为
API接口状态码,在Metrics中输入sum(rate(http_server_requests_code_total{app="$api_app"}[5m])) by (code)以code维度统计api接口的状态码

8.3.6 添加 rpc 接口状态码仪表盘
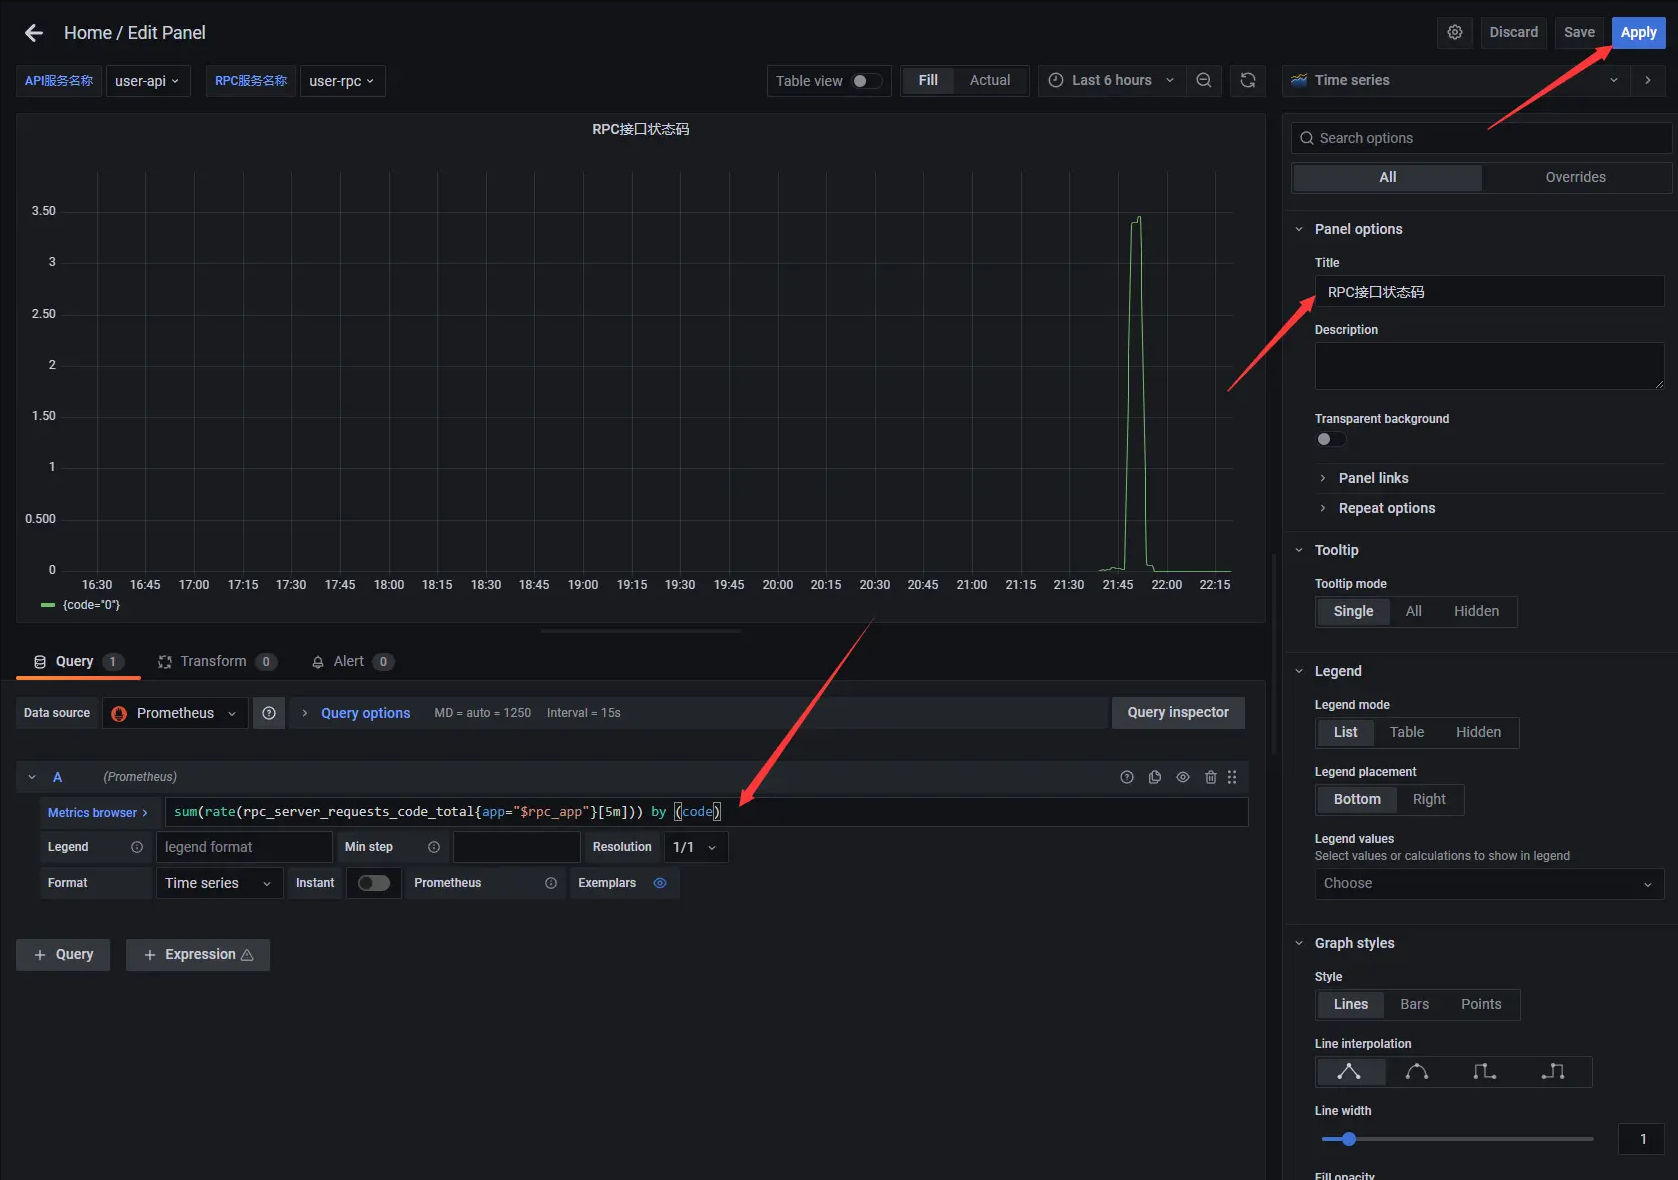
- 再新建一个面板,修改面板标题为
RPC接口状态码,在Metrics中输入sum(rate(rpc_server_requests_code_total{app="$rpc_app"}[5m])) by (code)以code维度统计rpc接口的状态码
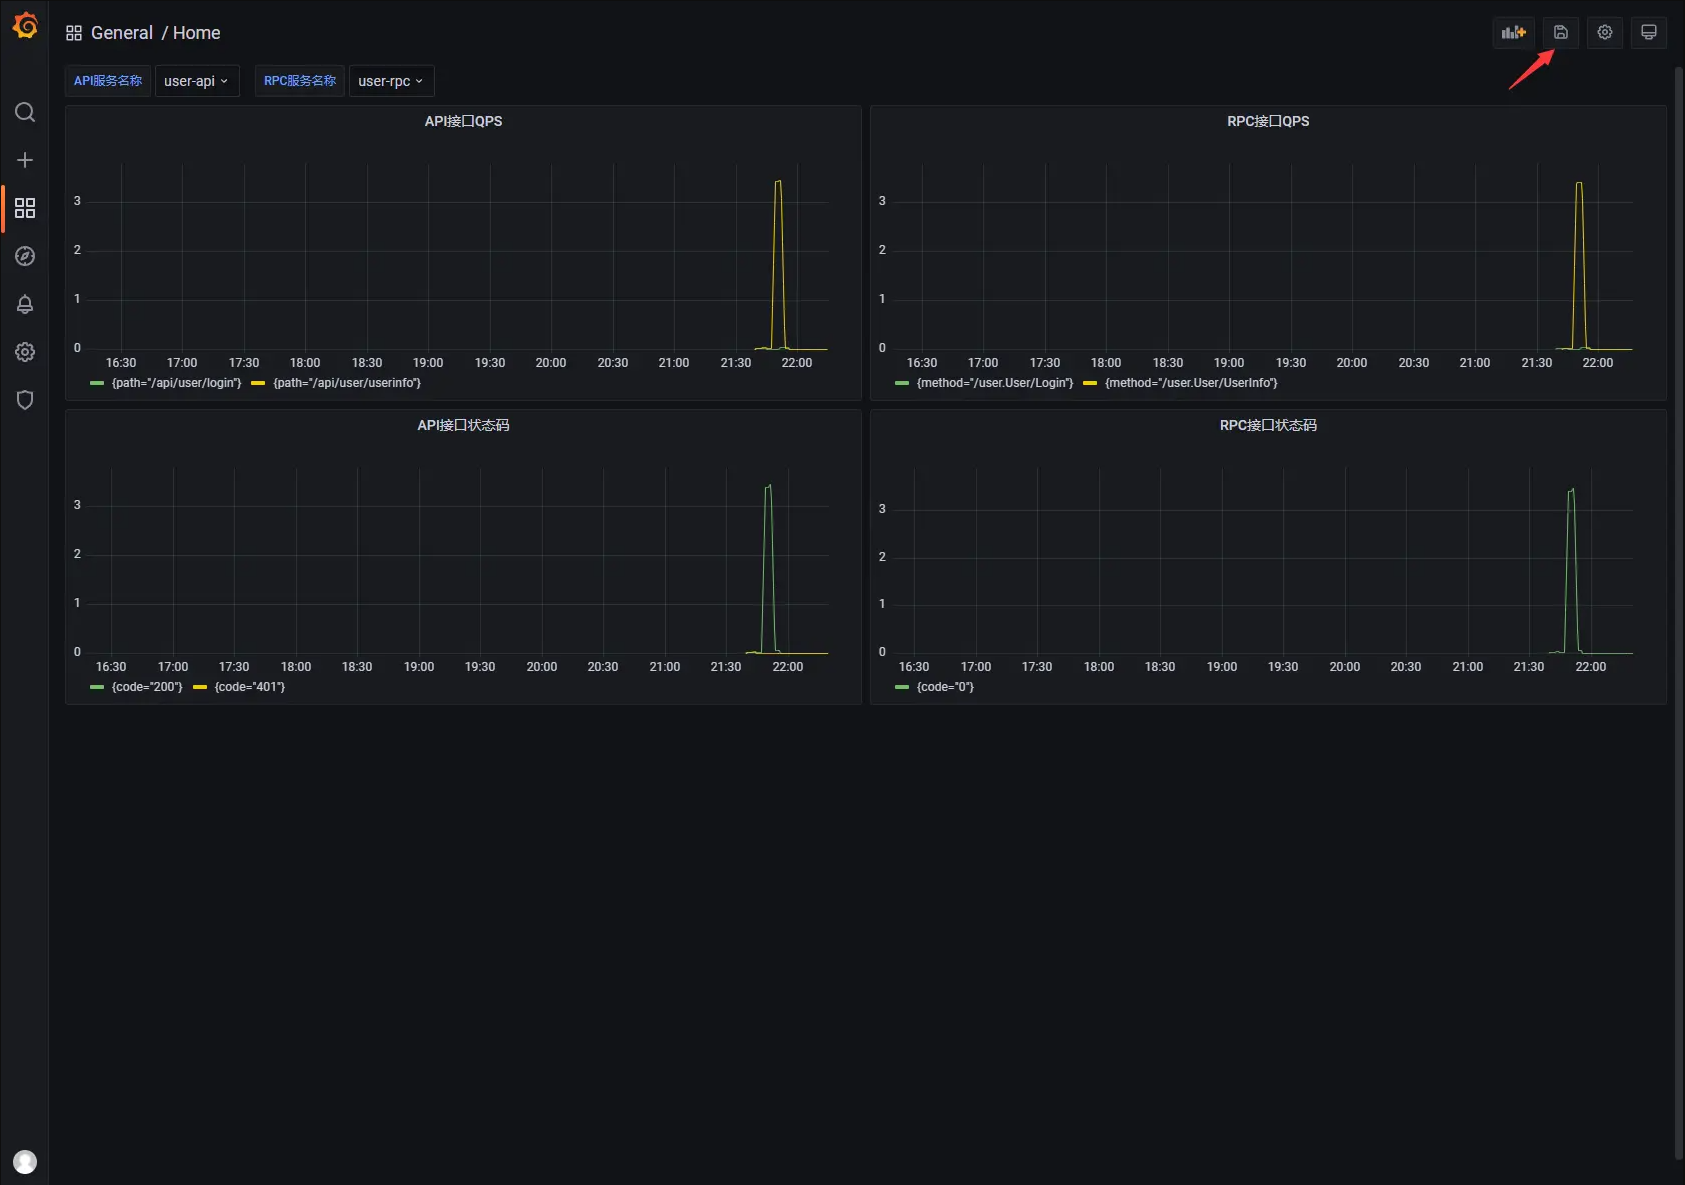
8.3.7 保存仪表盘
- 调整下面板位置,选择右上角
Save dashboard按钮保存仪表盘。
项目地址
https://github.com/zeromicro/go-zero
https://gitee.com/kevwan/go-zero
欢迎使用 go-zero 并 star 支持我们!
微信交流群
关注『微服务实践』公众号并点击 交流群 获取社区群二维码。 </job_name>
|


- 上一条: 带你十天轻松搞定 Go 微服务系列(七) 2022-01-25
- 下一条: 带你十天轻松搞定 Go 微服务系列(九、链路追踪) 2022-01-27
- 带你十天轻松搞定 Go 微服务系列(二) 2022-01-18
- 带你十天轻松搞定 Go 微服务系列(七) 2022-01-25
- 带你十天轻松搞定 Go 微服务系列(九、链路追踪) 2022-01-27
- 带你十天轻松搞定 Go 微服务系列(一) 2022-01-17
- 带你十天轻松搞定 Go 微服务系列(六) 2022-01-24